
Creating Audit Logs with Spring Boot and Sending to Elasticsearch
Audit logging is a critical component of modern application development, especially for tracking user activity, ensuring compliance, and improving the security of your systems. Audit logs offer a detailed record of what actions were performed, by whom, and when. For Spring Boot applications, audit logging can be seamlessly integrated with the Elasticsearch indexing and search engine, which provides a fast and scalable solution to store and search logs.
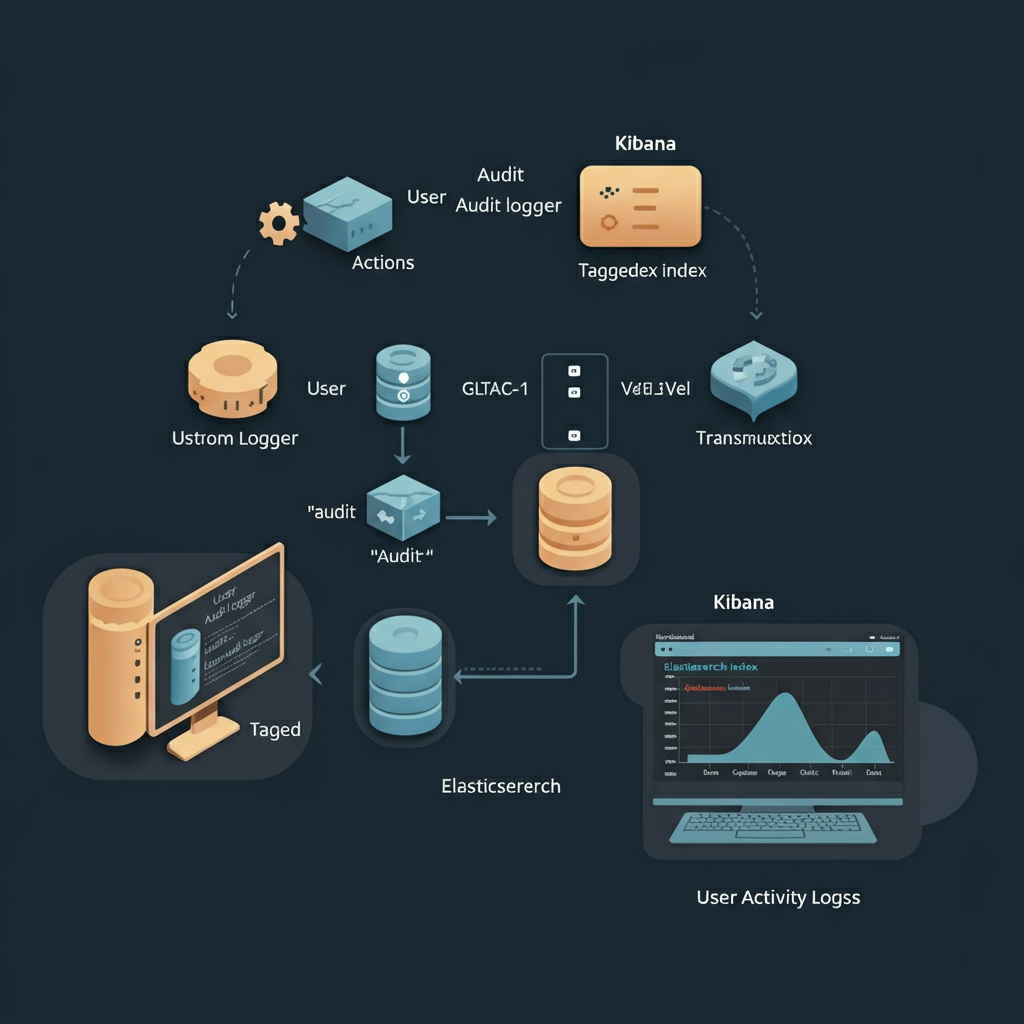
This guide will walk you through the process of setting up custom audit logging in Spring Boot and routing it to Elasticsearch. By the end, you’ll know how to create a separate index for audit logs (audit-*) and implement a real-world use case involving user activity tracking.
Table of Contents
- Why Audit Logging is Important
- Setting Up a Custom Audit Logger in Spring Boot
- Tagging Audit Logs Separately from Application Logs
- Indexing Audit Logs to a Separate Pattern in Elasticsearch
- Use Case Example: Tracking User Activity
- Summary
Why Audit Logging is Important
Audit logs focus on recording detailed user and system activity within an application, making them crucial for observability, compliance, and security.
Key Benefits of Audit Logs:
- Compliance and Accountability: Many regulations (e.g., GDPR, HIPAA) require detailed records of user activity to ensure accountability.
- Security Monitoring: Audit logs help detect unauthorized actions or suspicious patterns of usage.
- Application Insights: Gain a better understanding of how users interact with your application.
- Debugging and Troubleshooting: Audit logs provide valuable context for resolving behavioral or security issues.
By separating audit logs from other application logs in Elasticsearch, you can focus on storing and processing only essential records, without being overwhelmed by general application logs.
Setting Up a Custom Audit Logger in Spring Boot
The first step in implementing audit logging in Spring Boot is to configure a custom logger that handles audit-specific entries. Spring Boot’s robust logging capabilities allow you to easily define a dedicated logger for this purpose.
Step 1. Add Dependencies
Ensure your Spring Boot application includes a logging dependency, such as Logback (default) or SLF4J.
No additional Maven dependencies are needed if you’re using Spring Boot’s default Logback support.
Step 2. Define a Custom Audit Logger
Update your logback-spring.xml file to include a dedicated appender for audit logs:
<configuration>
    <appender name="AUDIT" class="ch.qos.logback.core.rolling.RollingFileAppender">
        <file>logs/audit.log</file>
        <rollingPolicy class="ch.qos.logback.core.rolling.TimeBasedRollingPolicy">
            <fileNamePattern>logs/audit-%d{yyyy-MM-dd}.log</fileNamePattern>
            <maxHistory>30</maxHistory>
        </rollingPolicy>
        <encoder>
            <pattern>%d{yyyy-MM-dd HH:mm:ss} %msg%n</pattern>
        </encoder>
    </appender>

    <logger name="AUDIT_LOGGER" level="INFO" additivity="false">
        <appender-ref ref="AUDIT" />
    </logger>
</configuration>
Step 3. Log Audit Events in Your Application
Use the defined AUDIT_LOGGER to log audit events. Here’s an example of how to use the logger in a service:
@Service
public class AuditService {

    private static final Logger auditLogger = LoggerFactory.getLogger("AUDIT_LOGGER");

    public void logAuditEvent(String username, String action, String resource) {
        String auditMessage = String.format("User [%s] performed [%s] on [%s]", username, action, resource);
        auditLogger.info(auditMessage);
    }
}
This ensures that all audit logs are written to a specific log file (audit.log) and are separated from general application logs.
Tagging Audit Logs Separately from Application Logs
When shipping logs to Elasticsearch, tagging audit logs separately is an essential step to differentiate them from application logs.
You can achieve this by adding consistent metadata (tags) to your audit log entries. If you’re using JSON-encoded logs, you can add explicit fields to indicate their type.
Update the Logback Configuration
Modify the encoder in logback-spring.xml to format the logs as JSON:
<encoder class="net.logstash.logback.encoder.LoggingEventCompositeJsonEncoder">
    <providers>
        <timestamp />
        <message />
        <arguments />
        <customFields>{"logType":"audit", "application":"spring-app"}</customFields>
    </providers>
</encoder>
This metadata allows Elasticsearch to easily distinguish audit logs based on the logType field.
Verify Tagged Outputs
Audit log entries will now look something like this:
{
  "@timestamp": "2025-06-13T14:07:12",
  "message": "User [john_doe] performed [DELETE] on [Customer/12345]",
  "logType": "audit",
  "application": "spring-app"
}
By defining logType tags, you enable powerful filtering and querying in Elasticsearch.
Indexing Audit Logs to a Separate Pattern in Elasticsearch
To optimize log management, create a dedicated index pattern (e.g., audit-*) for audit logs in Elasticsearch. This improves query performance and provides better segregation of data.
Step 1. Configure Logstash to Process Audit Logs
If you’re using Logstash as part of your log pipeline, alter its configuration to route logs based on their logType.
Example Logstash Configuration for Audit Logs:
input {
  file {
    path => "/path/to/logs/audit.log"
    codec => "json"
  }
}

filter {
  if [logType] == "audit" {
    mutate {
      add_field => {
        "indexSuffix" => "audit"
      }
    }
  }
}

output {
  elasticsearch {
    hosts => "http://localhost:9200"
    index => "%{indexSuffix}-%{+yyyy.MM.dd}"
  }
}
This ensures audit logs are indexed separately as audit-* in Elasticsearch.
Step 2. Verify Index Creation
Check Elasticsearch for the new audit index:
GET /audit-*
You should see the new audit indices based on the audit-* pattern, holding only relevant log entries.
Use Case Example: Tracking User Activity
Audit logs are particularly effective for tracking user activity within an application. Let’s consider a real-world example.
Scenario:
You want to log and track the following user actions for compliance and debugging:
- Login and logout events.
- Data modifications (e.g., CRUD operations on sensitive entities).
- Authorization attempts.
Implementation:
- Log User Actions: Use the
AuditServiceyou configured earlier to log each important event:auditService.logAuditEvent("john_doe", "LOGIN", "AuthService"); auditService.logAuditEvent("admin", "DELETE", "Customer/12345"); - Query Logs in Elasticsearch: Filter logs for specific actions, users, or time ranges:
logType:"audit" AND message:"DELETE" - Visualize in Kibana: Create dashboards to monitor user activities such as:
- Top users by number of actions.
- Frequency of specific actions (e.g., DELETE, LOGIN).
- Unsuccessful authorization attempts.
Example Dashboard Insights:
- Pie Chart: Break down actions (LOGIN, DELETE, UPDATE) by frequency.
- Bar Chart: Visualize delete actions across users in a histogram.
- Table: List failed login attempts with usernames and timestamps.
These insights can help you understand user behavior and detect potential security issues, such as brute-force login attempts.
Summary
Implementing audit logging in Spring Boot and sending logs to Elasticsearch equips you with a powerful tool for tracking user activity, ensuring compliance, and improving system observability. Here’s what you’ve learned:
- Custom Audit Logger Setup: Define a dedicated audit logger to keep audit logs separate from application logs.
- Tagging and Metadata: Use JSON log formats to tag audit entries distinctly with fields like
logType. - Index Separation in Elasticsearch: Store audit logs in a dedicated
audit-*index pattern for better segregation and performance. - User Activity Tracking: Leverage audit logs to monitor user behavior and highlight suspicious patterns or trends.
With a clear setup process and actionable examples, you can now integrate audit logging into your Spring Boot application and enhance your system’s observability and compliance. Start implementing audit logs today for more secure and accountable applications!
