
Deploying ELK Stack in Kubernetes for Spring Boot Logs
Centralized logging is crucial for monitoring, troubleshooting, and optimizing Spring Boot applications, especially in a distributed microservices environment like Kubernetes. An ELK Stack (Elasticsearch, Logstash, Kibana) provides a robust solution for aggregating and visualizing logs from various containers. Deploying an ELK stack directly into Kubernetes brings additional scalability and simplifies the process of managing Spring Boot logs across multiple pods and namespaces.
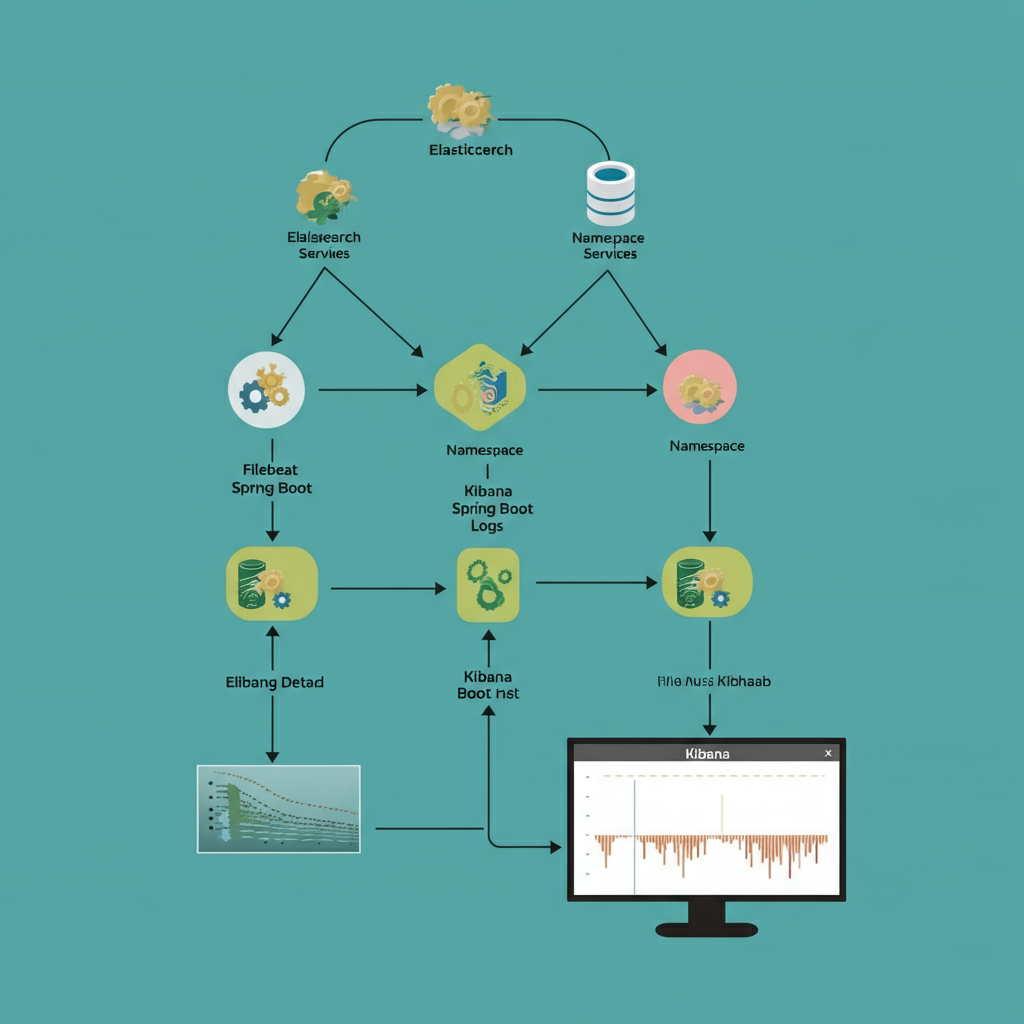
This guide will walk you through setting up the ELK stack in Kubernetes to handle logs for Spring Boot applications. We’ll cover deploying Elasticsearch and Kibana, configuring Filebeat as a DaemonSet, shipping Spring Boot pod logs to Elasticsearch, and creating custom Kibana dashboards for better insights.
Table of Contents
- Why Use ELK for Logging in Kubernetes?
- Running Elasticsearch and Kibana in Kubernetes
- Configuring Filebeat as a DaemonSet
- Sending Spring Boot Pod Logs to Elasticsearch
- Creating Kibana Dashboards per Namespace/Service
- Summary
Why Use ELK for Logging in Kubernetes?
Running Spring Boot applications in Kubernetes often involves multiple pods, services, and namespaces, each generating its own set of logs. Traditional practices of connecting to individual pods to read logs (kubectl logs) can become unmanageable. Here’s where the ELK stack shines.
Key Benefits of ELK for Kubernetes:
- Centralized Log Management: Collect and store logs from all pods across namespaces in one place.
- Real-Time Insights: Use Kibana’s dashboards to visualize logs and track trends such as error spikes or latency issues.
- Scalability: Elasticsearch scales easily with your Kubernetes cluster, handling large log volumes with ease.
- Searchable Logs: Query across logs using fields like
log.level,timestamp, and application-specific metadata. - Namespace and Service Segregation: Filter logs by namespace, service name, or pod for better context.
Next, we’ll look at deploying Elasticsearch and Kibana within Kubernetes as the foundation for our logging setup.
Running Elasticsearch and Kibana in Kubernetes
You can deploy Elasticsearch and Kibana in Kubernetes using Helm charts, which simplify the installation process. Here’s how to set them up.
Step 1. Add Helm Repositories
Ensure Helm is installed on your system. Then add the official Elastic Helm repository:
helm repo add elastic https://helm.elastic.co
helm repo update
Step 2. Deploy Elasticsearch
Install Elasticsearch by running:
helm install elasticsearch elastic/elasticsearch --namespace logging --create-namespace
Key Configuration Adjustments:
- Storage: Update
values.yamlto set persistent storage:volumeClaimTemplates: - metadata: name: elasticsearch-data spec: accessModes: [ "ReadWriteOnce" ] resources: requests: storage: 20Gi - Scaling: Set replicas for high availability:
replicas: 3
Step 3. Deploy Kibana
Next, deploy Kibana alongside Elasticsearch:
helm install kibana elastic/kibana --namespace logging
Verifying Installation:
- Access Kibana at
<K8s-node-IP>:<NodePort>. By default, it runs on port5601using the NodePort service type. - Check Elasticsearch health:
kubectl port-forward service/elasticsearch 9200 --namespace logging curl http://localhost:9200/_cluster/health
With Elasticsearch and Kibana running successfully, you’re ready to configure log shipping using Filebeat.
Configuring Filebeat as a DaemonSet
Filebeat is a lightweight log shipper that collects logs from pod containers and sends them to Elasticsearch. Deploying Filebeat as a DaemonSet ensures that every Kubernetes node runs a Filebeat pod to gather logs from all running containers.
Step 1. Install Filebeat
Download the Filebeat Kubernetes YAML manifest:
curl -L -O https://raw.githubusercontent.com/elastic/beats/7.x/deploy/kubernetes/filebeat-kubernetes.yaml
Step 2. Configure Filebeat
Update the filebeat-kubernetes.yaml file to tailor it for your environment. Modify the output to Elasticsearch:
output.elasticsearch:
  hosts:
    - http://elasticsearch.logging.svc.cluster.local:9200
Step 3. Deploy as a DaemonSet
Apply the Filebeat configuration:
kubectl apply -f filebeat-kubernetes.yaml
Filebeat will now collect logs from all containers on each node and ship them to the Elasticsearch cluster.
Step 4. Verify Logs in Elasticsearch
Execute the following command to confirm that logs are flowing into your Elasticsearch indices:
GET /filebeat-*/_search
You should see logs from your Spring Boot applications, ready to be visualized in Kibana.
Sending Spring Boot Pod Logs to Elasticsearch
Spring Boot generates structured logs using frameworks like Logback. To ensure these logs are Kubernetes-friendly, make the following adjustments.
Step 1. Enable JSON Logging
Update logback-spring.xml to emit logs in JSON format:
<configuration>
    <appender name="JSON" class="net.logstash.logback.appender.LogstashSocketAppender">
        <destination>${logstash.host}:5044</destination>
        <encoder class="net.logstash.logback.encoder.LogstashEncoder" />
    </appender>

    <root level="INFO">
        <appender-ref ref="JSON" />
    </root>
</configuration>
Step 2. Verify Logs in Filebeat
Filebeat automatically collects Spring Boot pod logs from container stdout. To verify:
kubectl logs -f <filebeat-pod> -n logging
You’ll see Filebeat streaming Spring Boot logs to Elasticsearch.
Creating Kibana Dashboards per Namespace/Service
Now that logs are flowing into Elasticsearch, use Kibana to create dashboards segmented by namespace and service.
Step 1. Create Index Patterns
- Go to Management > Data Views (Index Patterns).
- Add a pattern for application logs, e.g.,
filebeat-*. - Select
@timestampas the default timestamp field.
Step 2. Build Dashboards
Dashboard 1. Namespace-Specific Logs
- Use filters to display logs of a specific namespace:
kubernetes.namespace_name:"your-namespace" - Add visualizations such as:
- Logs by log level (
INFO,ERROR). - Service traffic trends with line charts.
- Logs by log level (
Dashboard 2. Service-Level Tracking
Filter based on kubernetes.labels.app for individual Spring Boot services:
kubernetes.labels.app:"order-service"
Dashboard 3. Log Volume Analysis
- Create bar charts to illustrate log volumes across namespaces or services.
- Include error rate visualizations for identifying high-error services.
Step 3. Save and Share Dashboards
Share dashboards with your team to analyze namespace-specific trends and service behavior.
Summary
Deploying the ELK stack in Kubernetes for Spring Boot logs provides centralization, scalability, and actionable insights. Here’s a recap of the key steps:
- Deploy Elasticsearch and Kibana: Use Helm charts for quick setup and cluster scaling.
- Configure Filebeat as a DaemonSet: Collect Spring Boot pod logs across nodes efficiently.
- Route Logs to Elasticsearch: Emit JSON-structured logs from Spring Boot pods.
- Visualize in Kibana: Build insightful dashboards by namespace or service.
By following this guide, you’ll streamline log management in your Kubernetes cluster and gain the observability needed to maintain high-performance Spring Boot applications. Start deploying your ELK stack in Kubernetes today to take control of your logs!
